AX1828
Using the Report Builder, you can create and edit web reports using a drag-and-drop interface. Web reports are intended to be intuitive for report builders to create and easy for report viewers to use.
Web reports support two different ways to display reporting data in a grid:
- Dynamic rows: Dynamically display data rows based on a specified dimension or grouping.
- Fixed rows: Use predefined fixed row structures to organize data rows into sections with headers, totals, and subtotals.
The Report Builder opens when you do either of the following:
- Create a new web report from the Intelligence Center.
- Edit an existing web report from the Intelligence Center or from the report viewer.
Overview of the Report Builder
The Report Builder is organized into three tabs:
- Build: Designs the report data and configure report properties. This is the default tab.
- Parameters: Enables and configures interactivity for the report. Report users can dynamically change the data that displays in the report using report parameters.
- Filters: Defines report-level filters to limit the data shown in the report.
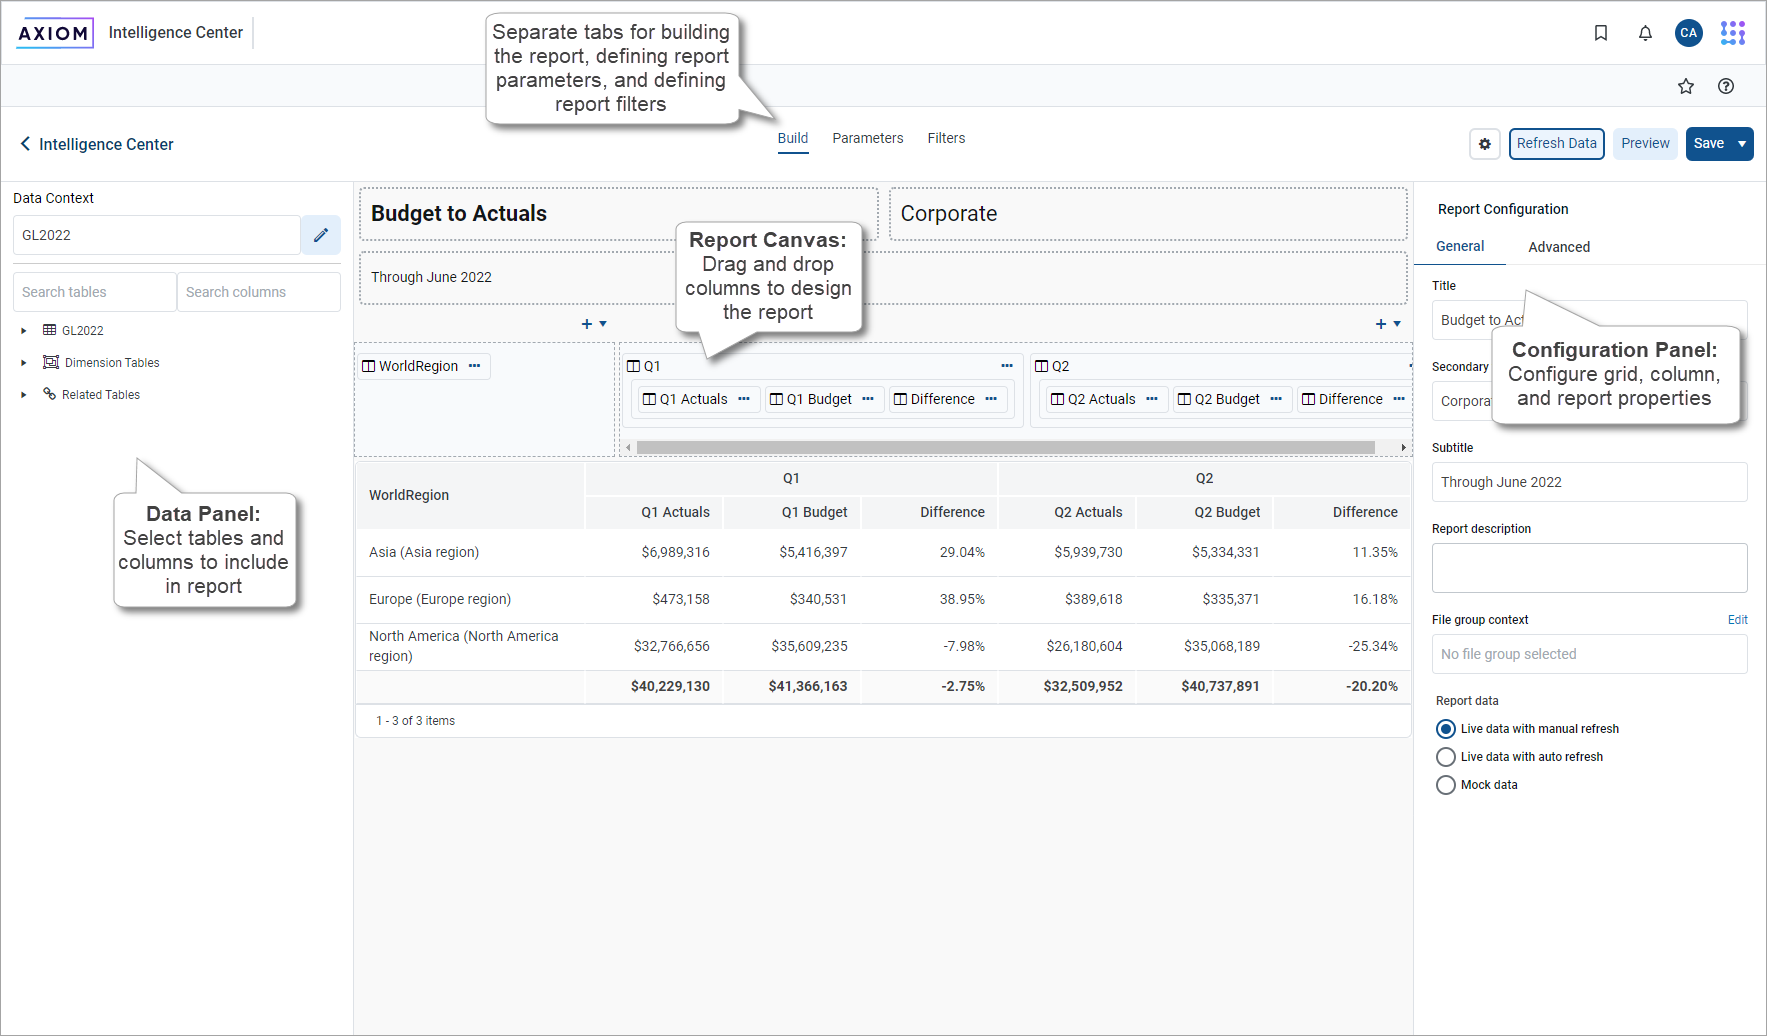
In the Build tab, the Report Builder has three main areas:
-
The data pane on the left side is where you select the data to include in your report.
-
The report canvas in the middle is where you build the report. Columns can be dragged and dropped from the Data Pane to the Report Canvas. You can also create calculations to appear in the report columns and define column groups.
-
The configuration pane on the right side is where you define properties for the report, the data grid, and the individual columns. You can configure properties such as report titles, drilling options, and column formatting.
As you build and configure the report, a preview of the grid appears in the report canvas. Several options are available to control how data appears in this grid. For more information, see Change data display options for the Report Builder.
Build a report in the Report Builder
The following is an overview about how to build a report in the Report Builder:
-
Define a data context: Each report must have a specified primary table to determine the data context for the report. After the data context is defined, you can build the report using columns from the primary table and from related tables.
-
Define report titles: Define the report title text and an optional report description.
-
Define the grid rows: Web reports can use dynamically generated rows based on a dimension or they can use a fixed row structure. Do one of the following depending on the type of report to create:
-
For dynamic rows, add a row dimension to the grid by dragging and dropping a table column.
-
For fixed rows, specify a fixed row structure by modifying the grid properties.
-
-
Add data columns and calculated columns: Drag and drop table columns out to the grid to define the data columns for the report and define calculated columns, as needed. You can also define column groups to create grouped headers in the report.
-
Configure grid properties: Configure grid properties, such as the total row and user interaction options, including enabling and configuring drilling options, as needed. You can also adjust the default formats for various column types.
-
Configure column properties: Configure properties for each column such as alignment, width, number format, and column filters.
-
Define report filters: Define general and table-specific filters to limit the data shown in the report grid.
-
Define report parameters: Optionally, create and configure report parameters to enable users to dynamically change the data shown in the report.
Change data display options for the Report Builder
As you build and configure the report, a sample of the grid data appears in the report canvas. Choose how data appears in the sample grid as you build the report.
NOTE: The sample grid shows how the report data appears to report viewers but it is not intended to be an exact representation of the final report. To see the report as it appears to report viewers, use the Preview feature.
-
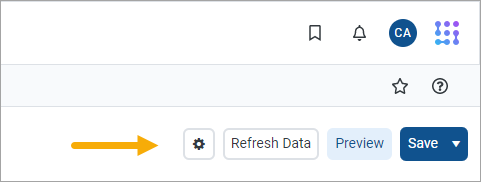
On the Build tab of the Report Builder, click the gear button at the top of the page to load the Report Configuration properties.
-
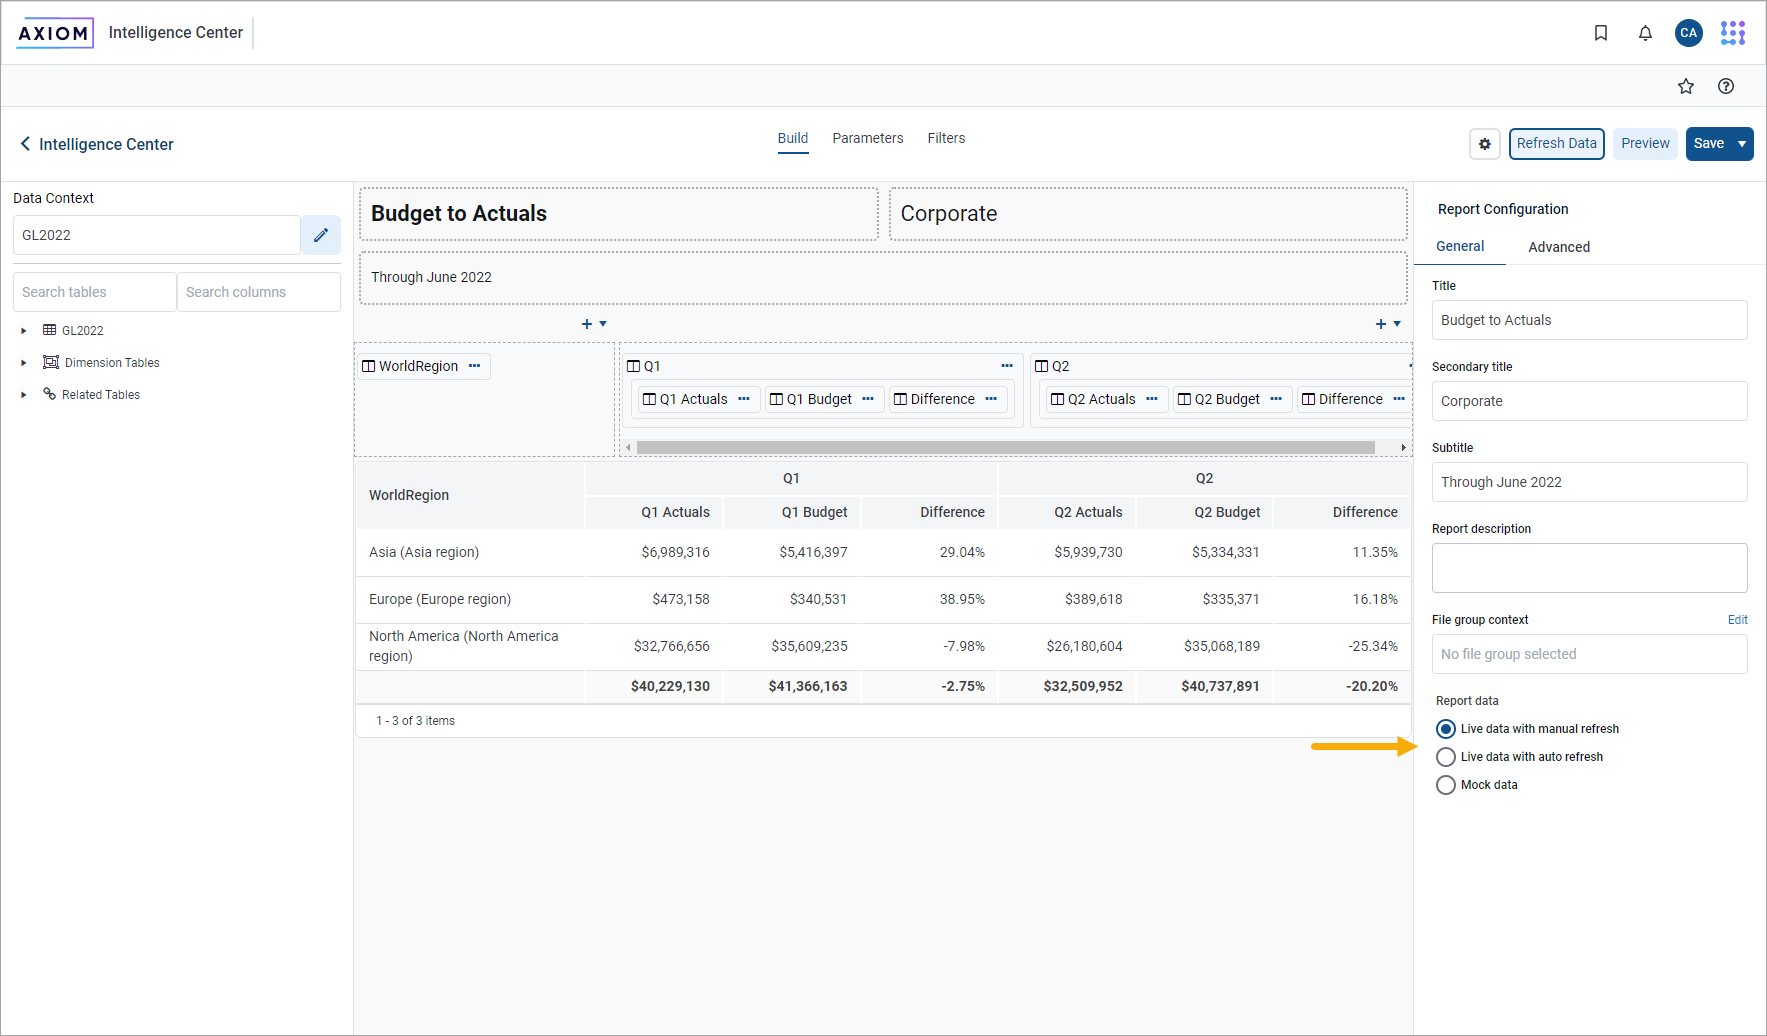
Select one of the following options for Report data:
-
Live data with manual refresh (default): Live data appears in the grid, however, you must manually refresh the data after making configuration changes that affect the data shown. This is for performance reasons so that you do not have to wait for data queries to complete to continue working on your report. When using this option, data updates are handled as follows:
-
If you add a new column or make a configuration change that would affect the data shown in the column, the column is blank. To populate the grid for data in this column, click Refresh Data.
-
If you make a configuration change that would affect the data shown in the entire grid, the grid is blank. To populate the grid with the current data, click Refresh Data.
Refresh Data is only available when using this option.
-
-
Live data with automatic refresh: Live data appears in the grid and the data automatically updates after you make any configuration changes. Generally speaking, only use this option when the report queries a small set of data so that updates are quick or when you do not expect to be making many configuration changes that affect data.
-
Mock data: Mock data appears in the grid. When using this option, you can get a basic idea about how the report columns and format appear to the user without viewing actual data. This is a good option if you do not need to made configuration changes that affect the data or if you do not need to view the data while you are making these changes.
-
Even if you are viewing live data, the grid shown in the report canvas is meant as a guide to help you build the report—it is not intended to be a fully functional representation of the report. To see how the report appears to report viewers, click Preview.
NOTE: The Report data option is not saved in the report and your selection is not saved for future Report Builder sessions. Every Report Builder session defaults to using live data with manual refresh.
Preview a report
The sample grid in the report canvas accurately reflects some report configuration details, such as column headers and number format. However, other configuration details are not reflected in the sample grid. For example:
-
Column width may not be accurately reflected in the sample grid. Initially, the grid expands to fit the available space. After there are enough columns to fill the space, the column width is honored.
-
The sample grid only shows up to ten rows of data (when using dynamic rows) and does not show paging options.
-
Drilling options are not available in the sample grid.
-
Report viewer options to sort and filter column data are not available in the sample grid.
-
You cannot use report parameters on the sample grid.
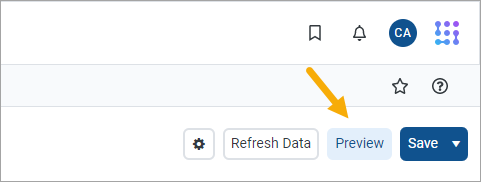
If you want to see how the report appears to users in the report viewer, including all user interaction options for the report, click Preview at the top of the Report Builder.
The report preview opens in a separate dialog that overlays the Report Builder. Using this preview, view the report data and explore features like sorting, filtering, and drilling the report. When you are done viewing the preview, click Close at the bottom of the dialog to return to the Report Builder (or click the X in the top right corner).
The report preview does have a few limitations. Export and share options are not available in the report preview. Additionally, if you use hyperlinks in the report, the hyperlinks always open in a new tab, even if they are configured to open in the same tab—this is done so that clicking a hyperlink does not close the Report Builder.
Save a report
Click Save at the top of the Report Builder to save the report. If the report is new, a prompt appears for you to define a name and folder location for the report. Otherwise, the existing report is saved.
If you have opened an existing report for editing and you want to save a copy of it with a new name, click the down arrow to the right of Save and select Save As.
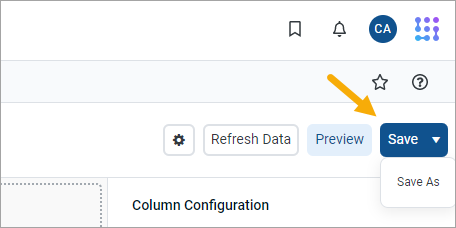
NOTE: The Create Web Reports security permission is required to use Save As.
If you have made changes to the report but have not yet saved, a prompt appears for you to save when you attempt to close the browser tab or go to a new location.
