AX1832
When creating a web report, add as many columns as needed to define the data that you want to display in the report. You can also define calculated columns, for instance, to show the difference between two columns.
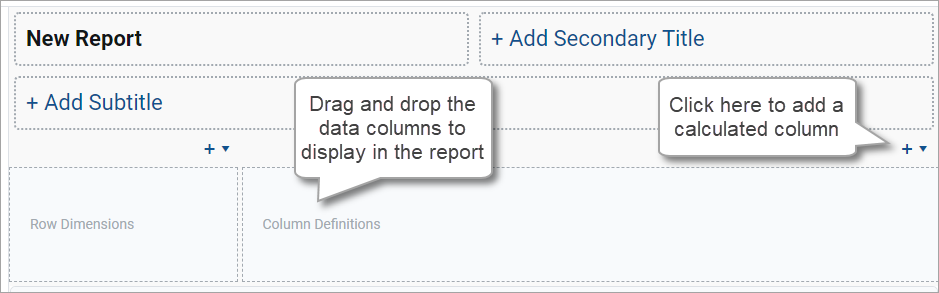
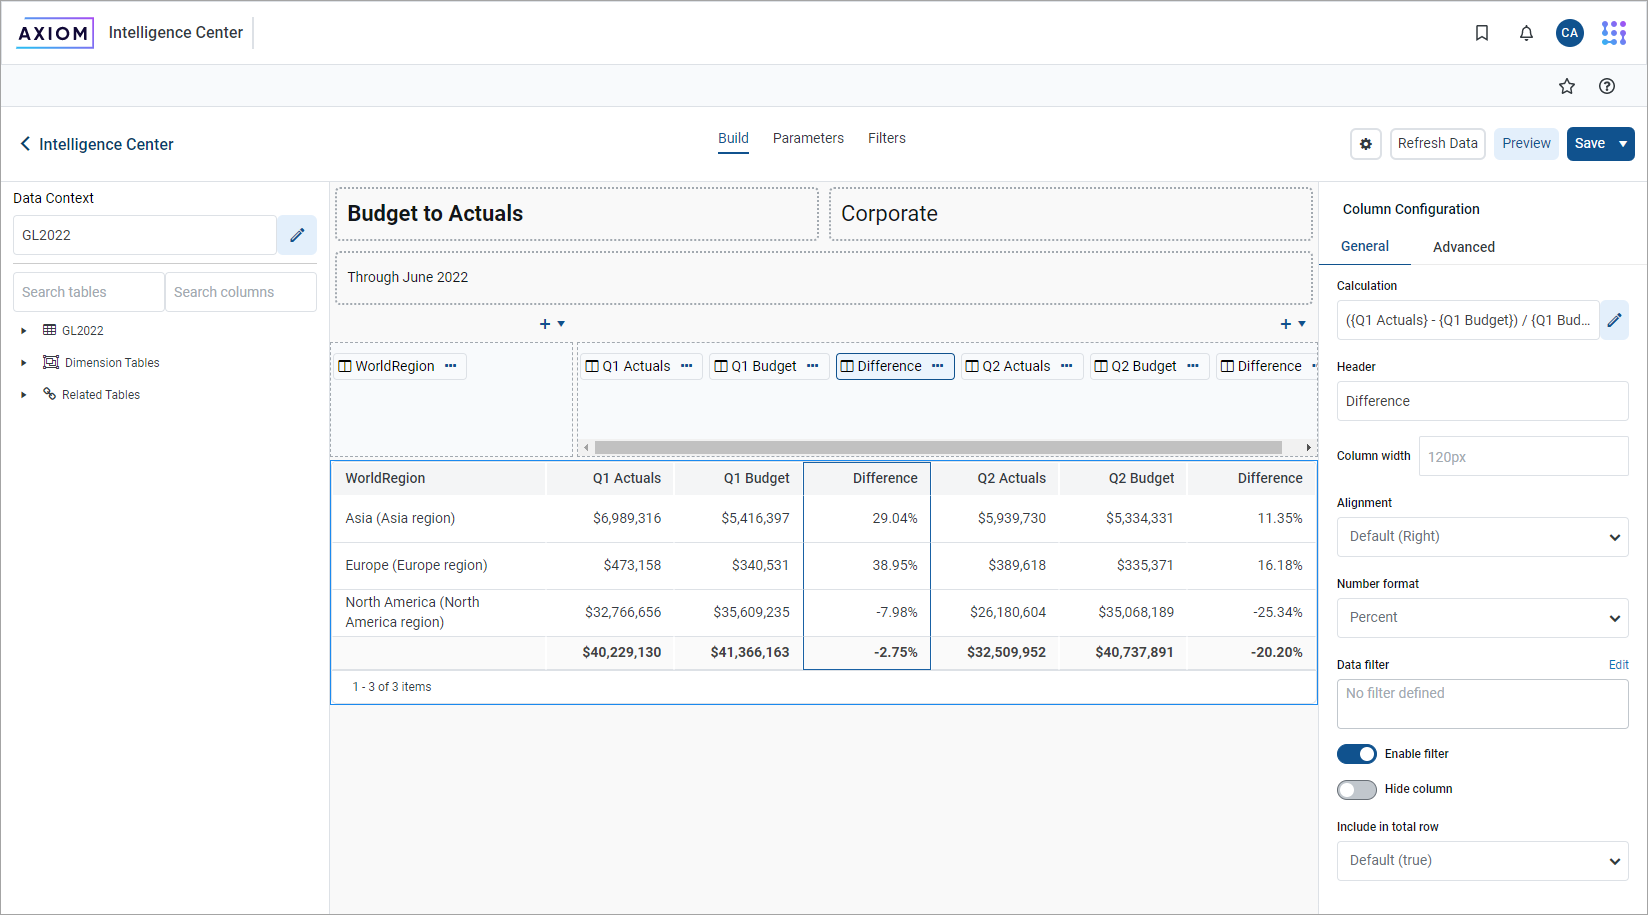
The data columns and calculated columns for the grid are placed in the right box at the top of the report canvas, known as the Column Definitions box. This box defines the columns to display in the report. Although it is possible to add columns and calculated columns to the Column Definitions box before specifying a row dimension or a fixed row structure, the grid in the report canvas does not populate until you define the rows.
Add data columns
To display data in the report, you can drag and drop table columns from the data pane to the Column Definitions box in the report canvas. The data pane displays the tables and columns that are eligible to be included in the report based on the selected data context (primary table) and the specified row dimension.
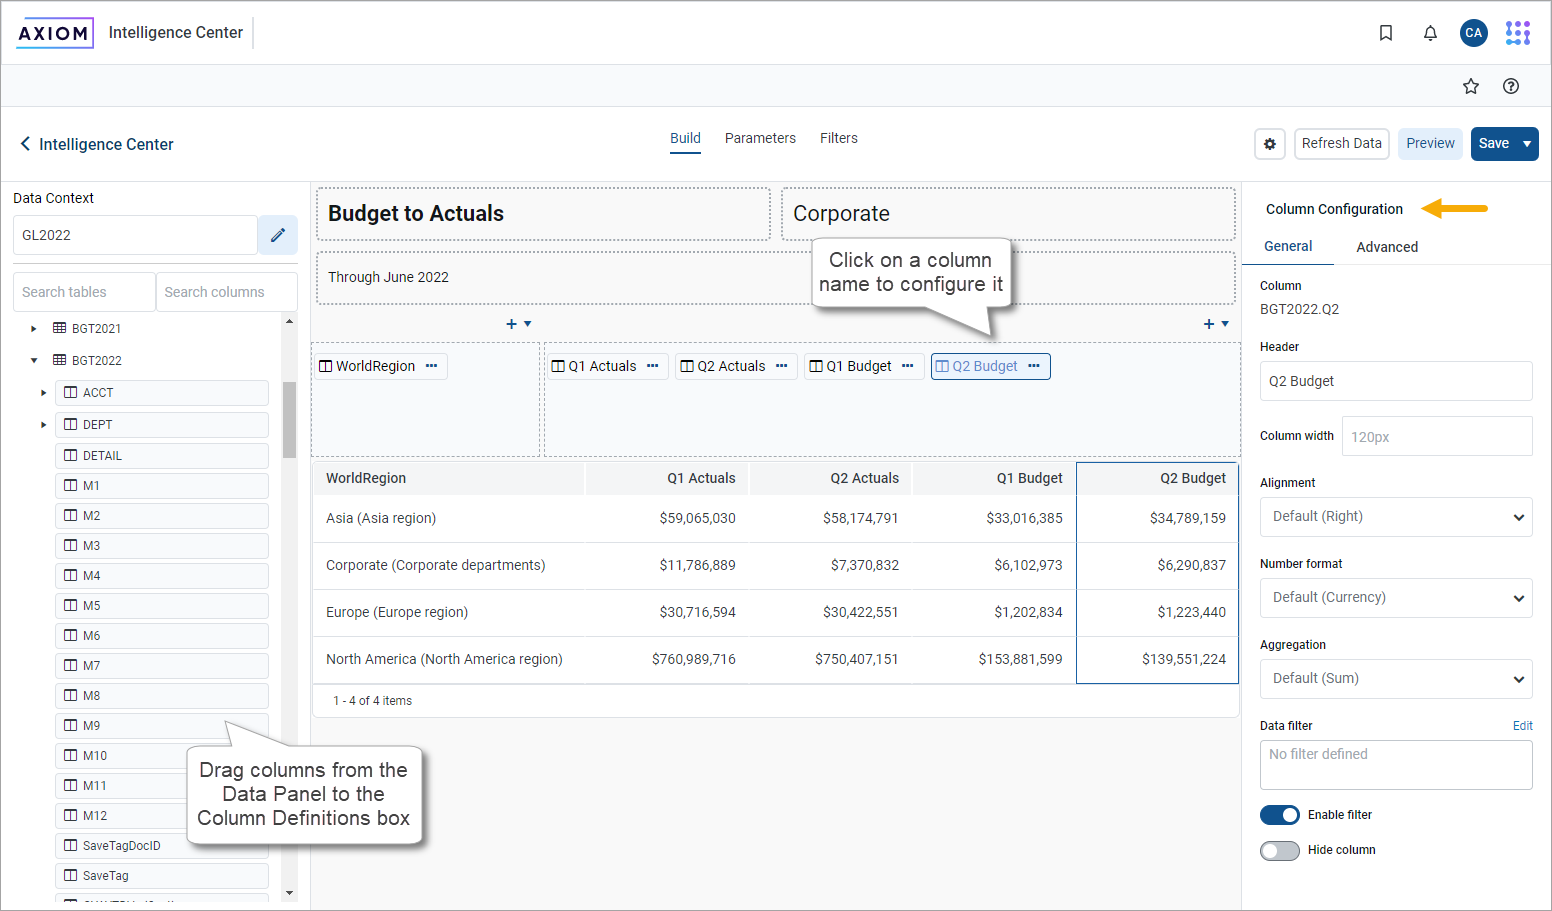
- On the Build tab of the Report Builder, in the data pane, expand the table tree until you locate the column that you want to add to your report. You can also use the search boxes at the top of the pane to find a particular table or column by name.
-
Drag and drop the column to the Column Definitions box at the top of the report canvas.
NOTE: When using the default behavior, the new column renders as blank in the report until you click Refresh Data.
-
If the column is not in the preferred location within the grid, drag and drop it within the Column Definitions box to reorder the columns.
-
Use the Column Settings in the configuration pane to configure display properties for the column, such as column width, alignment, header text, and formatting. For more information, see Configure column properties for a web report.
By default, when you drag and drop a column to the grid, that column is selected and its column properties appear in the configuration pane. You can return to the column properties at any time by clicking the column name in the Column Definitions box.
NOTE: If you enable Use fixed rows for the grid, the Report Builder does not dynamically update the tables listed in the data pane based on the specified fixed row structure. If you drag and drop a column from a table that is not valid in the context of the fixed row structure, a generic error occurs when the Report Builder attempts to populate the grid.
Add calculated columns
Use calculated columns to display totals, differences, percentages, and other calculations within a column of the report. Calculations can be based on columns from related tables that are eligible to be included in the report.
-
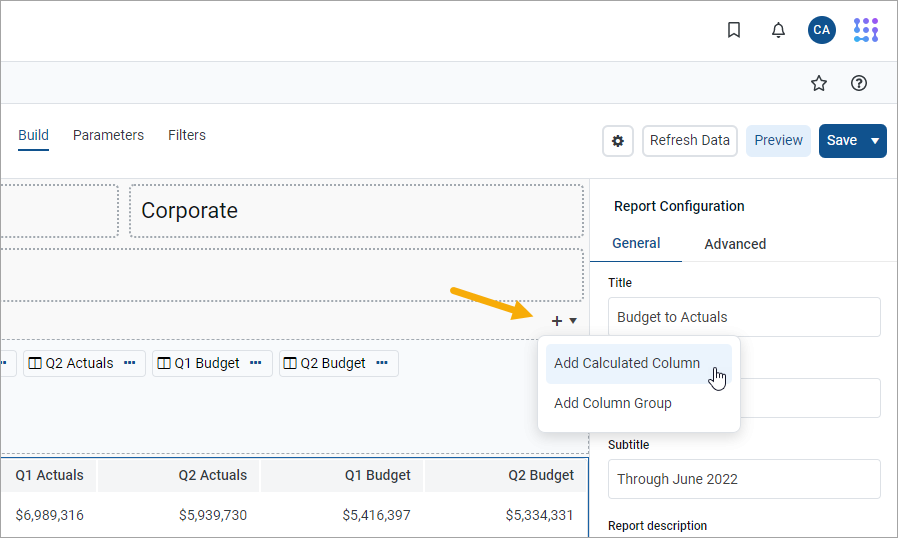
On the Build tab of the Report Builder, in the report canvas, click the plus sign + in the top right corner of the Column Definitions box, and then click Add Calculated Column.
-
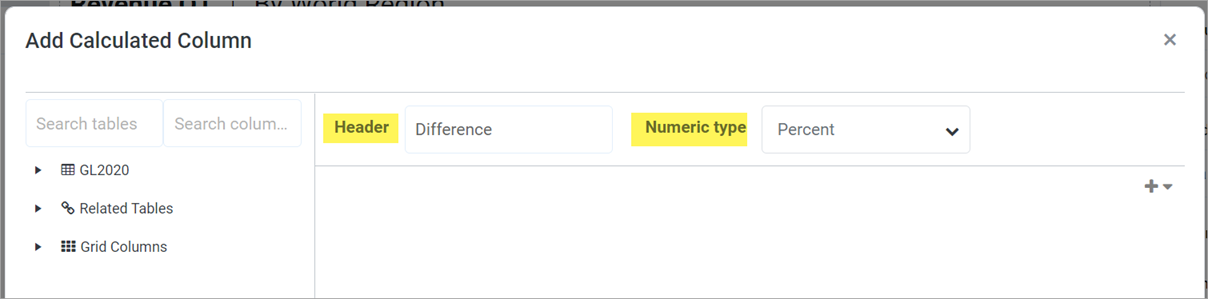
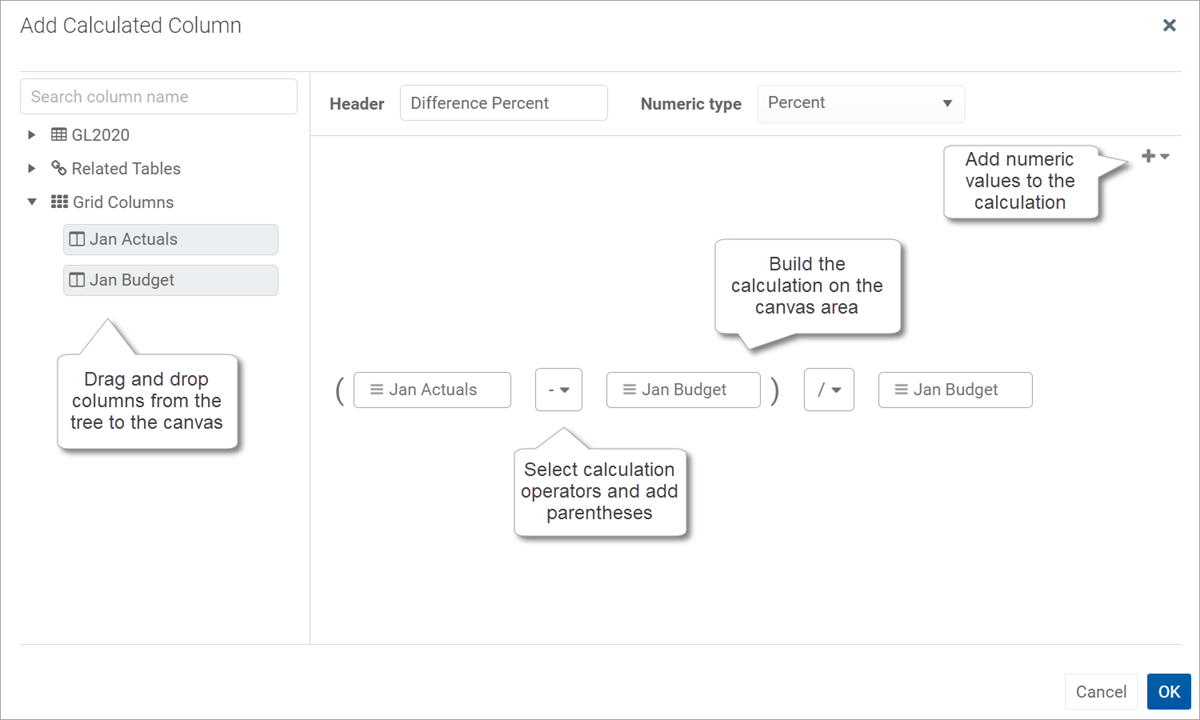
At the top of the Add Calculated Column dialog, define the following properties:
-
Header: Enter the column header text for the calculated column. This is effectively the name of the calculated column. By default, the header text is Calculation.
-
Numeric type: Select the preferred numeric type for the calculated column. If you leave this as Default, the default numeric type for calculated columns is Currency.
You can change these properties later using the Column Configuration properties in the configuration pane.
-
-
To create the calculation, drag and drop columns from the table tree on the left to the calculation canvas. For more information, see Define calculations.
-
When you complete creating the calculated column, click OK.
The calculated column is added to the Column Definition box. By default, the new column is blank until you click Refresh Data.
-
If the calculated column is not in the preferred location within the grid, drag and drop it within the Column Definition box to reorder the columns.
-
Use the Column Configuration properties in the configuration pane to configure display properties for the column, such as column width and alignment. For more information, see Configure column properties for a web report.
By default, when you define a calculated column, that column is selected and its column properties appear in the configuration pane. You can return to the column properties at any time by clicking the column name in the Column Definitions box.
Define calculations
Using the Add Calculated Column dialog, build a calculation based on columns from related tables that are eligible to be included in the report. The column does not have to exist in the grid to be used in a calculation. You can also use numeric values in the calculation.
The left side of the dialog lists a table tree of available columns, while the right side of the dialog—the calculation canvas—is where you build the calculation. To start the calculation:
- Drag and drop two columns out to the canvas. The two columns are separated by an operator selector.
- Select the preferred operator.
Continue building the calculation by dragging and dropping additional columns and selecting the operator. You can also do the following:
- Numeric values: To add a numeric value to the calculation, click the plus icon + at the top right of the dialog. You can then move, reorder, or delete the numeric value just like columns.
- Reorder items: To change the order of columns in the calculation, drag and drop them on the canvas.
- Parentheses: To add parentheses to a part of the calculation, select Add Parentheses from the operator selector. The two columns affected by the operator will become enclosed in parentheses.
- Delete items: To delete an item, hover your cursor over the column and then click the trash can icon.
Calculations use the following operators: addition (+), subtraction (-), multiplication (*), and division (/). Use parentheses to determine calculation order, such as: (GL2023.Q1-BGT2023.Q1)/BGT2023.Q1.
Calculations use the following columns:
- Numeric columns from the primary table, whether those columns are also in the grid.
- Numeric columns from related tables, whether those columns are also in the grid.
-
Numeric columns from the grid, including other calculated columns. Grid columns appear using the header text defined for the column.
If you use a table column from the grid instead of from the table itself, the calculation uses the column as it is configured to appear in the grid. For example, if the grid column has a column filter or uses an alternate aggregation, the calculation is based on that modified version of the column.
• If you drag and drop a column from the primary table or a related table, it appears on the canvas using the column name only—such as M1. You can hover your cursor over the column box to see a tooltip with the full table.column name—such as GL2023.M1. If you drag and drop the column from the Grid Columns node, it appears using the defined header text for the column.
• If you use a grid column in the calculation, you cannot delete the grid column from the grid because deleting it would cause the calculation to become invalid. An error message appears if you attempt to delete a referenced column from the grid. To resolve the issue, you can do one of the following: edit the calculation to remove the reference, delete the calculated column, or configure the grid column as hidden so that it can still be referenced in the calculation but not appear in the report.
Edit calculated columns
You can edit an existing calculated column to change the calculation.
- On the Build tab of the Report Builder, in the report canvas, click the calculated column in the Column Definitions box.
-
On the General tab of the Column Configuration properties, click the Edit icon
 to the right of the Calculation box.
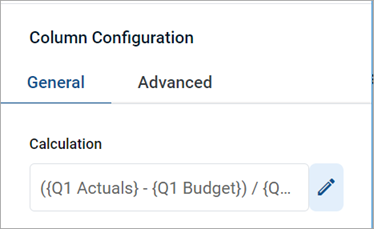
- In the Edit Calculated Column dialog, edit the calculation as needed, and then click OK.
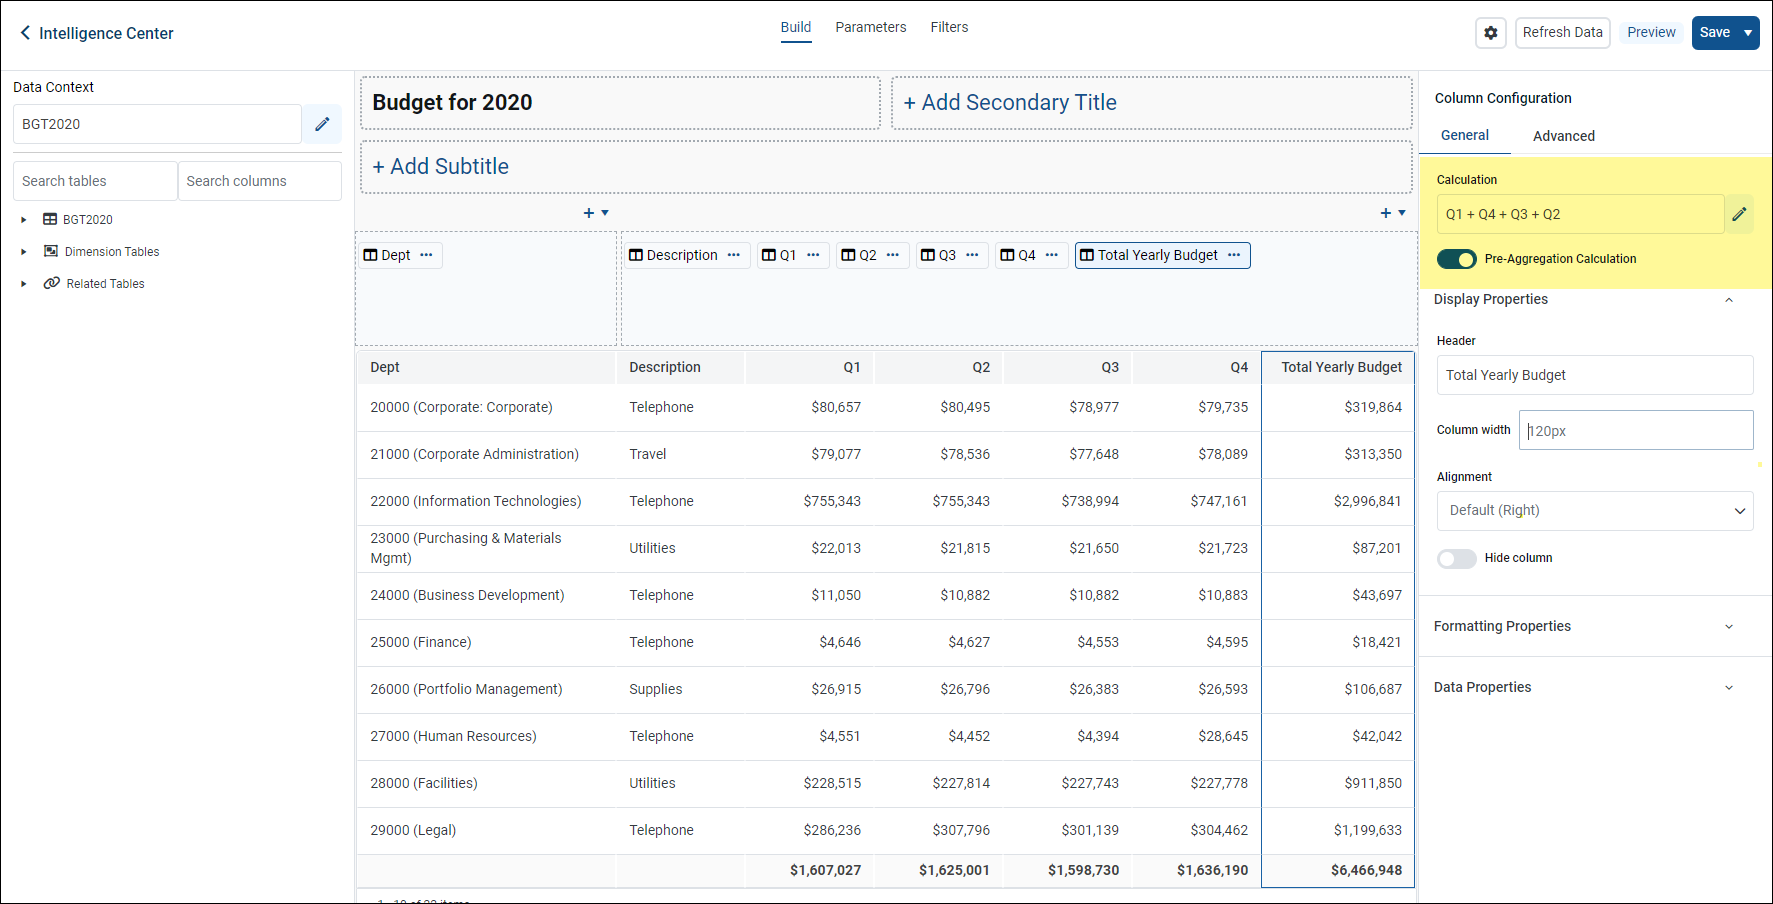
Pre-aggregation in calculated columns
You can pre-aggregate calculations in a calculated column. A pre-aggregate calculation is applied to data rows in the query before those rows are aggregated by the row dimension.
In this example, the sum of columns Q1 through Q4 have been summed and presented in a new calculated column, Total Yearly Budget and the Pre-Aggregation Calculation button is selected.
Use of pre-aggregation calculations impacts the total row if you enable it. Behavior is as follows:
-
Post-aggregation calculations: The calculation is performed on the total row values of the source columns.
-
Pre-aggregation calculations: The values in the calculated column are summed for presentation on the total row.
-
Pre-aggregation calculations can use alternate aggregations, if preferred. The field is unhidden for the calculated column when you enable pre-aggregation. If you set an alternate aggregation and then disable pre-aggregation, the alternate aggregation field is re-hidden and ignored.
Additional column actions
After you add data columns and calculated columns to the grid, you can further adjust them as follows:
-
Reorder columns: To reorder a column in the grid, drag and drop it to any location in the Column Definitions box. You cannot drag and drop a column from the Column Definitions box to the Row Definitions box. If you accidentally dragged a column to the wrong box, you must remove the column and then drag and drop it again from the data pane.
-
Remove columns: To remove a column from the grid, click the ellipsis icon to the right of the column name and then select Delete Column. Use caution before removing a calculated column—if you later decide you want to re-add the column, you must re-create the calculation from scratch.
-
Copy columns: To copy a column in the grid, click the ellipsis icon to the right of the column name and then select Clone Column. A copy of the column is created to the right of the original column. The new column has the same properties as the original column except that the text (Copy) is appended to the header text. You can modify the new column, as needed, to differentiate it from the original, such as to define a filter for the column or to modify the calculation.
NOTE: If you copy a table column in the grid (as opposed to a calculated column), it is not possible to point the column to a different table column. The purpose of copying a table column is to display multiple instances of the same table column but using different filters or different aggregation types.
-
Group columns: If you want a set of columns to display under a group header, you can define a column group and then add the columns to that group. For more information, see Define column groups for a web report.
-
Configure columns: To configure display properties for a column, select the column name in the Column Definitions box, and then use the Column Configuration properties in the configuration pane. For more information, see Configure column properties for a web report.
