AX1835
The column properties define the presentation of each column in the grid. Using the column properties, you can configure:
- Display properties, such as header text, column width, alignment, and number formatting.
- Data properties, such as column filters, alternate aggregation, and display formats for data.
- Grid behavior properties, such as inclusion in the total row and whether users can sort and filter using the column.
In the Report Builder, define the column properties in the right configuration pane. Define the column properties for both table columns and calculated columns.
-
On the Build tab of the Report Builder, in the report canvas, click a column name in either the Row Dimensions box or the Column Definitions box to select that column.
-
Complete the Column Configuration properties that appear in the configuration pane.
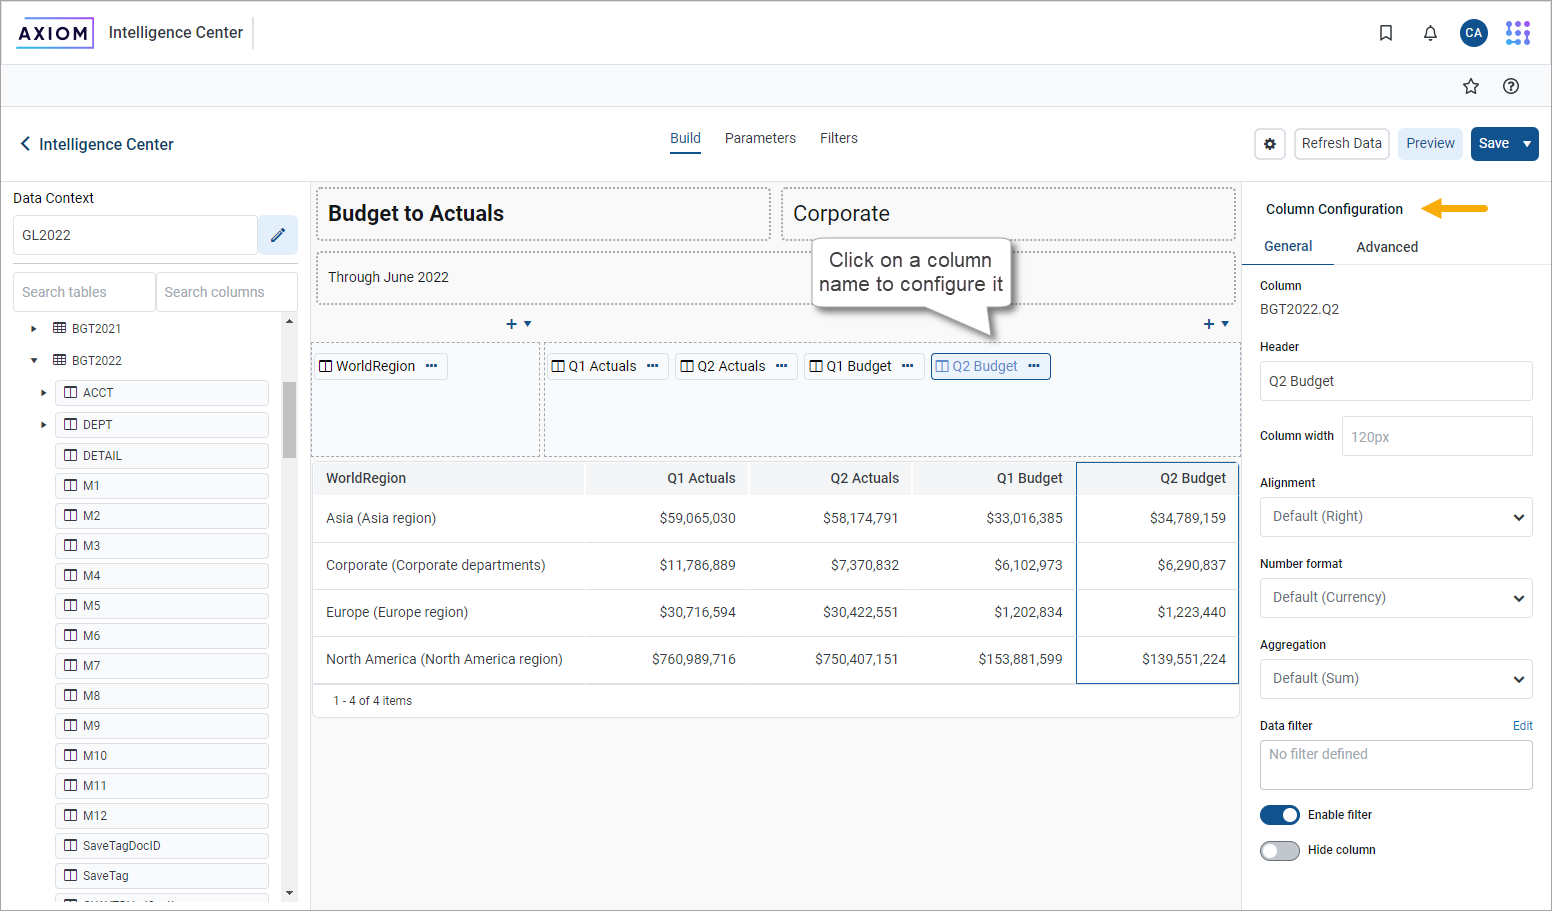
The column configuration properties are separated into two tabs:
- General: Basic column properties to review and configure for all columns in the grid.
- Advanced: Advanced column properties to configure, as needed.
General column properties
The following column properties are available for web reports on the General tab of the Column Configuration pane. These properties apply to table columns, calculated columns, and dynamic columns.
| Item | Description |
|---|---|
|
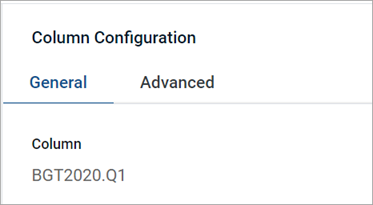
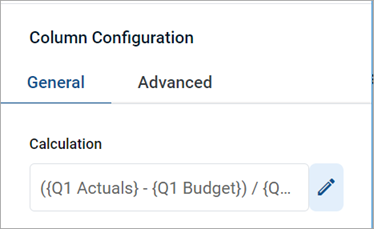
Column or Calculation or Default Column |
The following information appears at the top of the pane to identify the column:
|
|
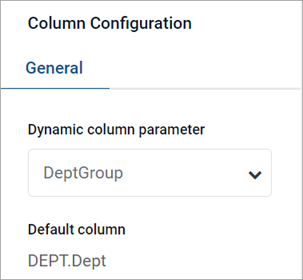
Dynamic column parameter |
The Column List report parameter to associate with the dynamic column. Only applies when the current column is a dynamic column. For more information, see Use Column List report parameters. |
|
Header |
The header text to appear on the column header. Enter the preferred header text.
If the column is a dynamic column, the header text is defined in the Column List parameter settings, for each column that is available for you to select. Within the report canvas only, the dynamic column appears using the header Dynamic. |
|
Column width |
The width of the column in the grid in pixels. Enter the preferred column width as a whole integer between 30 and 600. The default width depends on the column data type and is configured at the grid level. If you do not enter a custom width, the default width appears in the Column width box in gray text. If you leave this default width and change the grid-level defaults, the column updates to use the new default width. For more information, see Configure grid properties in a web report. |
|
Alignment |
The alignment of the column values. Select one of the following: Default, Left, Right, Center. The default alignment depends on the column data type, and is configured at the grid level. If a column is set to use Default and change the grid-level defaults, the column updates to use the new default alignment. For more information, see Configure grid properties in a web report. |
|
Number Format |
Select Formatting Properties to work with number formats. The number format used by the column. Only applies to columns that hold numeric data. Select one of the following:
This option is not available for use with dynamic columns. |
|
Aggregation
|
Select Data Properties to configure Aggregation. The aggregation type used to aggregate data queried from the database column. Does not apply to calculated columns or to columns used as row dimensions. If you want to override the default aggregation type for a database column, select an aggregation type. |
|
Data filter |
Select Data Properties to configure the optional Data filter. Defines a filter to limit the data shown in this column. Use the column-level data filter instead of a grid-level data filter when you want the filter to impact just this column. For more information, see Use column filters. |
|
Enable filter |
Specifies whether report viewers can filter the report based on the column contents.
This property does not apply to any column in the grid if Use fixed rows is enabled in the Grid Configuration properties. Fixed row reports do not support column filtering by users. |
|
Hide column |
Specifies whether the column is hidden in the report. Does not apply to columns used as row dimensions.
|
|
Select Display Properties to work with configure the description text. Specifies the descriptions to appear for dimension values. This option only applies to key columns, alternate key columns, and validated columns that have an associated description column.
NOTE: If the dimension table has multiple description columns (meaning columns where Describes Key is True), the first description column is used. If the column is a dynamic column, this option is applied when the currently selected column has a description column, and ignored when it does not. |
|
|
Include in total row |
Specifies whether the column is included in the total row, if a total row is enabled in the Grid Configuration properties. Does not apply to columns used as row dimensions. Select one of the following:
If a column is included in the total row, it is treated as follows:
This option does not apply if you enable Use fixed rows in the Grid Configuration properties. Columns will be included or excluded in subtotal or total rows using the default behavior. |
|
Date part to retrieve |
Specifies the date or date-time part to retrieve if the column is a Date or Date Time column. For example, you can return the full date value, or just the year or month, or the fiscal year or month. For more information, see Date part and format options. |
| Date format |
Specifies the format to display the date values if the column is a Date or Date Time column. The available format options depend on the specified Date part to retrieve. For more information, see Date part and format options. The label and visibility of this setting varies depending on the selected date part. For example, if you select Month as the date part, the label for this setting is Month format. If you select a date part that does not have any formatting options, such as Year, this setting is hidden. |
Advanced column properties
The following column configuration properties are available for web reports on the Advanced tab of the Column Configuration pane. These properties apply to table columns and calculated columns. Dynamic columns do not use these properties.
Header properties
| Item | Description |
|---|---|
|
Header text (row 1) |
The header text to display on the column header. Enter the preferred header text. NOTES:
|
|
Header text (row 2) |
The header text to appear on the second row of the column header. Enter the preferred header text. This property is only available if you have enabled Multi-row header. |
|
Multi-row header |
Specifies whether the column header has multiple rows:
Enabling a multi-row header is different than wrapping header text. If you enable multi-row headers, you can define two separate rows of header text. A line break separates each row. If you enable autowrap, each row of header text wraps individually. If you just want a single row of header text that wraps, leave this option disabled and then enable Autowrap header text. |
|
Autowrap header text |
Specifies whether header text wraps:
|
|
Header alignment |
The alignment of the header text. Select one of the following: Default, Left, Right, Center. All column headers use Default alignment by default. By default, the header text uses the same alignment as the column contents (as determined by the Alignment property on the General tab). If you leave the header alignment set to Default, the header alignment adjusts to match the column alignment. If, however, you want the header alignment to be different than the column alignment, configure this property. |
Link properties
For more information about using hyperlink columns in web reports, see Display hyperlinks in web reports.
| Item | Description |
|---|---|
|
Enable link |
Specifies whether the column displays hyperlinks. Select this option if you want each row of this column to contain a hyperlink that dynamically incorporates the current column value. If you enable this option, the additional link properties in this section become available; otherwise they are hidden. |
|
Link type |
Specifies the type of link to display in the column:
NOTE: This option only appears if the report meets the requirements to support plan file links. Otherwise, all links are custom links by default, and this option does not appear. |
|
URL |
Specifies the URL to use in the hyperlink column. Enter a relative location in the Axiom Budget Planning and Performance Reporting system. The URL can use variables, as needed, so that the URL value is dynamic per row of the report. For example, imagine that the report contains the key column of a plan code table (such as Dept), and you want each plan code to link to the Process Routing page for a particular plan file process. The full URL to the Process Routing page uses the following syntax: https://mycompany.axiom.cloud/process/processdefinitionID/planfile?planvalue=plancode The process definition ID is constant for the URL but the plan code value needs to be the current row's department value. Use the /process/16682/planfile?planvalue={value} NOTE: Enter the relative URL with or without the beginning forward slash. When viewing the report, the column resolves to use the full URL with the current column value. For example, the row showing Dept 22000 has the following URL: https://mycompany.axiom.cloud/process/16682/planfile?planvalue=22000 When you click the hyperlink in this row, the Process Routing page for Dept 22000 appears for the plan file process associated with process definition ID 16682. NOTE: The URL property only appears if the specified link type is custom, or if the Link type option does not exist because all links in the report are custom. When using the plan file link type, the URL to the plan file is automatically generated by Axiom Budget Planning and Performance Reporting. |
|
Link text |
Specifies the text appearing for the hyperlink column. Enter the preferred text using variables, as needed. Note the following:
|
|
Link tooltip |
Specifies the tooltip to show when you hover the cursor over the hyperlink. Enter the preferred text, using variables, as needed. The same variable behavior noted previously for the Link text property also applies to this property. |
|
Open link in new tab |
Specifies whether the hyperlink opens in the same tab (replacing the report) or in a new tab. By default, the hyperlink opens in the same tab. Enable this option if you want the hyperlink to open in a new tab. |
Use column filters
Use the Data filter property to filter the data coming into a particular column. This filter only impacts the data in the current column; it has no impact on the rest of the report.
-
Click the Edit link over the Data filter box to open the Filter Wizard.
-
In the Filter Wizard, create the filter, as needed. For more information about how to use the Filter Wizard to create a filter, see Use the Filter Wizard in the Report Builder.
The tables available in the Filter Wizard depend on whether the current column is a table column or a calculation and the primary table specified as the Data Context of the report:
-
If the current column is a table column, the Filter Wizard shows that table and its dimension tables.
-
If the current column is a calculated column, the Filter Wizard shows the following tables:
-
If the calculated column only uses columns from a single table, the Filter Wizard shows that table and its dimension tables.
-
If the calculated column uses columns from multiple tables and the primary table is a data table, the Filter Wizard shows the common dimension tables for the tables involved in the calculation.
EXCEPTION: If the calculation includes a column from a dimension table, the Filter Wizard shows the common dimension tables for all related tables used in the report, regardless of whether the related table is used in this particular calculation.
-
If the calculated column uses columns from multiple tables and the primary table is a reference, the Filter Wizard shows the primary table and its dimension tables.
EXCEPTION: If the calculation only consists of columns from related tables (no columns from the primary table or dimension tables), the Filter Wizard shows the common dimension tables for all related tables used in the calculation.
-
Create a filter using any column on the available tables. If you choose to use a predefined global filter from the Filter Library, the global filter must be based on the same eligible table columns.
-
-
After the filter statement is complete, click OK to close the Filter Wizard and add the filter to the Data filter box.
After you define a filter for a column, ymodify it as follows:
-
To edit the filter, click the Edit link over the Data filter box again and change the filter within the Filter Wizard.
-
To delete the filter, click the Clear link over the Data filter box.
Data filters defined at the column level are combined with any filters defined at the column group level and at the grid level. All relevant filters are combined using AND to determine the data that can display in a particular column.
If a column has a defined filter, a filter icon appears next to the column name in the sample grid of the report canvas. This icon is intended to let report builders know about the column filter at-a-glance. The icon does not appear in the report viewer.
• If you define a data filter for a calculation, the filter is applied to the columns referenced in the calculation, and then the calculation occurs.
• You cannot define Column-level data filters for columns used as row dimensions. To limit the rows shown in the grid, use a report-level filter in the Report Configuration properties.
Frequently asked questions
I defined a column filter but it isn't impacting the grid data as I expected. Why do I still see rows that don't match the column filter?
A column filter only filters the data coming into that specific column. If you want to define a filter that impacts the entire report, including the row data, define a filter at the report level. Select the report title and then use the Report Configuration properties to define one or more Report filters.
To illustrate the difference, imagine the following uses of a filter to only show data from the West region:
-
Report: When you define the general filter
Dept.Region='West'for the report, the entire grid is filtered to only show data from the West region. Row dimension values (such as departments) only show if they belong to the West region, and column data is limited to only show data for the West region. -
Column: When you define the filter
Dept.Region='West'on a column, that single column is filtered to only show data from the West region. Other columns and row dimension values are not limited by this filter. You might do this to create a report that shows the different region data in different columns, such as to compare data from the West, East, North, and South regions side-by-side.
