AX1585
Include process columns in a web report to show status information for plan files in a plan file process. You can show information, such as:
- Current process status for a plan file, including the current step name and number.
- Process step history per plan file, including the name and number of each step the plan file has been active in, the plan file's step status, and the time spent in the step.
- Step statistics, such as average time spent in each step and number of workbooks in each step.
To report about process information, you must associate the web report with a file group. The process columns are then available for you to add to the report and return information about the designated plan file process for the file group.
Configure a web report to use process columns
Process columns are not available for use in the Report Builder unless the report is associated with a file group. This association is made in the Report Configuration properties.
Primary table prerequisite
Process reporting only works if the primary table selected as the Data Context for the report is compatible with the plan code table for the file group. In the majority of cases, select the plan code table itself. For example, if the plan code table is Dept, select Dept as the primary table for the report. However, if needed, use a table with a lookup to the plan code table instead.
-
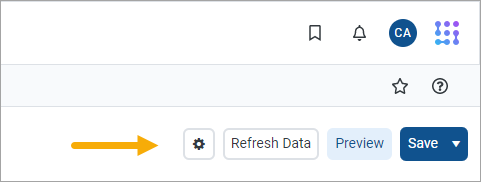
On the Build tab of the Report Builder, click the gear button at the top of the page to load the Report Configuration properties.
-
In the Report Configuration properties, click the Edit link above the File group context box.

-
In the Choose File Group Context dialog, select a file group or a file group alias, and then click OK.
Use the radio buttons at the top of the list to toggle between viewing file group aliases or file groups. When viewing file group aliases, the name of the file group that is currently assigned to the alias appears in parentheses after the alias name.
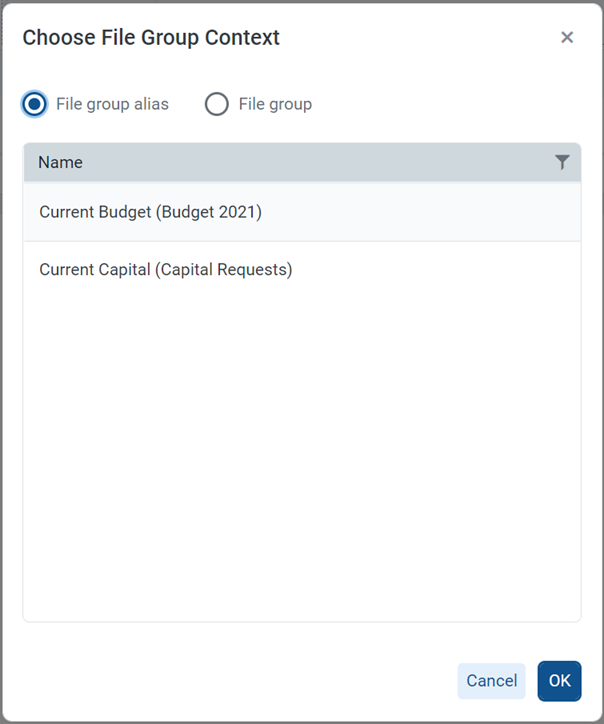
Selecting a file group alias means the report is dynamically associated with the file group that is currently assigned to the alias. For example, if you update the Current Budget alias so that it points to the Budget 2024 file group instead of the Budget 2023 file group, the report updates to show the process information for the Budget 2024 file group.
NOTE: The selected file group must have a designated Plan File Process in the file group properties.
After you select a file group context, a new node appears in the data pane named Process Management. The process columns are listed under this node organized into Process Status Columns and Process Step Columns. To use a process column in the report, drag it to the setup boxes at the top of the Report Canvas just like any other column.

Use process columns
The following tables describe what each process column returns, as well as usage and configuration guidance for each column. Additionally:
-
When you use a process column in a report, the plan code values are automatically filtered to only return codes that have any activity in the plan file process. It is not necessary to filter the report by a ShowOnList column to suppress plan code values that are not active in the file group.
-
Use process columns as row dimensions or as column definitions; however, only certain process columns make sense to use as row dimensions. See the column details for more information.
Process status columns
Use the process status columns to display current process status information for plan codes in the file group. These columns are best used to create a report that shows the current step and status for each plan file.
When using the process status columns, the row dimension for the report is only the key column of the plan code table for the file group. For example, if the plan code table is Dept, the row dimension is the Dept key column of that table. This means that each row of the report is a plan code in the file group, showing the process status for that plan code. Note the following:
| Column name | Description |
|---|---|
|
Process Status |
Returns the current process status for each plan code. For example, Active, Stalled, Completed, or Aborted. |
|
Current Step |
Returns the name and/or number of the current step of the plan file.
|
|
Process Initiator |
Returns the name of the user who initiated the process for the plan file. This column is only available if the associated file group is an on-demand file group. |
Process step columns
Use the process step columns to return process information for each step that a plan file has been active. When using process step columns, set the row dimension as follows depending on the goal of the report:
-
If the goal of the report is to see step detail by plan code, set the row dimension to both the key column of the plan code table and the Process Step column. This means that the report contains a separate row for each combination of plan code and step.
-
If the goal of the report is to see grouped information about the step, set the sum level for the query to just the Process Step column. This is useful to see information, such as average time in step, and the count of workbooks that have been active in the step.
| Column name | Description |
|---|---|
|
Process Step |
Returns the name and/or number of the step. When using process step columns, make this column a row dimension for the report.
Sub-steps are returned using decimals, such as 2.1 and 2.2. Even though this column is a string column, if the report is sorted by the Step Number column, the numbers are sorted in the correct order. |
|
Step Status |
Returns the status of the step per plan file. This column is only useful when the row dimension is set to both the key column of the plan code table and the Process Step column. |
|
Time In Step |
Returns the time spent in each step per plan file. Although the raw value for this column is seconds, the total seconds are translated into the highest useful time value for display in the report—whether that is seconds, minutes, hours, or days. Therefore, one plan file may list the time in step as "25 minutes" while another plan file may list the time in step as "2 days." If you set the row dimension for the report to just the Process Step column, change the Aggregation for the Time In Step column to Average so that the column returns the average time spent in the step (for all plan codes that were ever active in the step). Otherwise, the column returns the total time spent by all plan codes in the step, which is likely not a useful value. NOTE: NOTE: If you use this column in a calculation, the calculation is based on the raw seconds value. Therefore, if you want to return the time in step using the same time unit for all plan codes, regardless of how long they have been in the step, use a calculation to do so. For example, divide the time in step by 86400 to convert the seconds to days.
|
|
Workbook Count |
Returns the count of workbooks that have been active in the step. This column is only useful when the row dimension is set to just the Process Step column, so that you can see the count for all plan codes that have been active in the step. If the key column of the plan code table is included as the row dimension, the Workbook Count always returns 1 for each plan code/step combination, which is likely not a useful value. This column always uses Count aggregation and cannot be changed. |
Filtering based on process columns
When a report uses process columns, you can filter the report based on these columns.
-
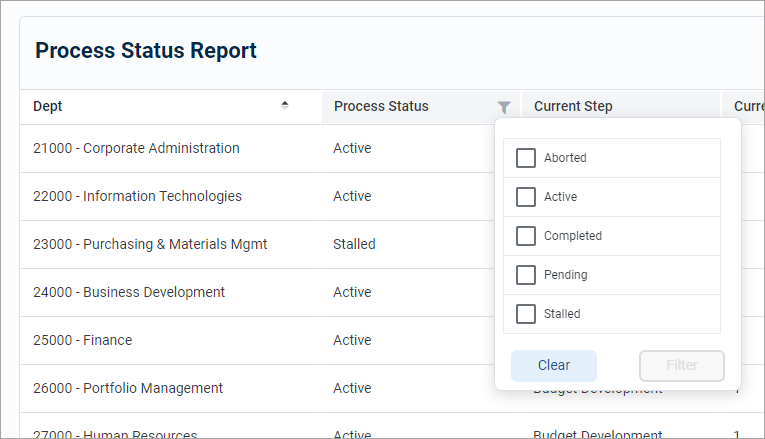
User filtering: If a process column is enabled for user filtering (Enable filter is enabled for the column), users viewing the report can filter it spontaneously. For example, a user may want to filter the Process Status column to only see plan files that are currently stalled in the process.
-
Report filtering: Use process columns to define a general report filter or a table-specific report filter to limit the data shown in the report. For example, you might want to filter the report to only show plan files in a certain step or with a certain status. The Process Management columns are only available in the Filter Wizard dialog when you configure the report to enable use of process columns.

You cannot use Process Management columns as column filters on columns or calculations, or on groups. The Process Management columns node is hidden when you open the Filter Wizard in these contexts.
NOTE:
• When filtering by process columns, base the filter on the same set of columns that you are using in the report (Process Status Columns or Process Step Columns). Although it is possible to cross-filter, the results may not be as expected because these two sets of columns are looking at the process information from two different angles.
• If you are filtering by Time in Step, enter the number as seconds. The Filter Wizard then converts that number to the largest relevant time unit to show in the dialog.
Example process reports
The following screenshots show some of the reports you can create using process columns. These examples only use process columns but the reports could contain additional columns from the plan code table or from related data tables in cases where it makes sense to show this additional information.
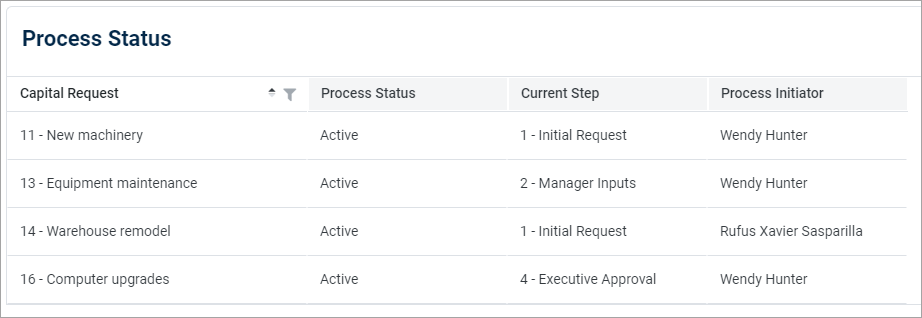
The first example shows a report using process status columns for the purpose of viewing the current status of each plan code. The row dimension is the key column of the plan code table (CapitalID).
The second example shows a report using process step columns for viewing the process history of each plan code. The row dimension is set to the step name and the key column of the plan code table (Dept). Filter the Dept column to view the history for a specific plan code.

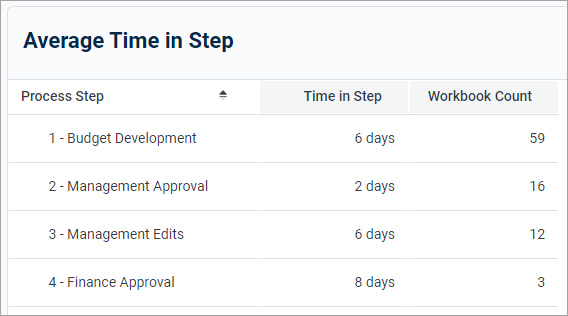
The third example shows a report using process step columns for viewing process statistics. The row dimension is set to the step number only so that the process data is aggregated at the step level. The columns show the count of workbooks that have been active in each step, as well as the average time in step per workbook.