AX1520
System administration in the Web Client
The Axiom Web Client provides access to several system administration features in addition to the user features.
-
In the Web Client, click the Strata icon
 in the navigation bar The common bar across the top of pages in the Web Client. The Navigation bar provides access to system and product features..From the Area menu, select System Administration.
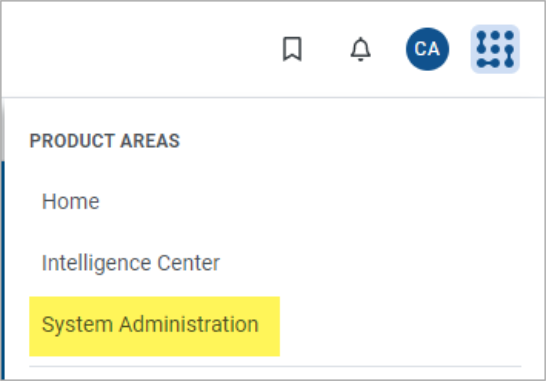
NOTE: This menu item only appears to admins and to users with one of the following permissions: Administer Tables, Administer Picklists, Administer Software Updates, Administer Locked Items, Browse Audit Log, Scheduled Jobs User, and subsystem admins.
After you enter the System Administration area, the following items appear:
-
System Administration menu: The Navigation menu across the top of the page updates to show the available administration features. Admins can access all features. Non-admins only see the features that they have permission to access.
-
Dashboard: The landing page for the System Administration area is a dashboard that shows system information and status details. Admins see all of the information. Non-admins only see the basic system details such as the system name and version.

System administration features
Use the Navigation menu across the top of the page to access the following features in the System Administration area.
Tools
| Item | Description |
|---|---|
|
View table properties, manage data diagrams, and manage picklist and KPI tables. NOTE: The Table Manager always appears on the System Administration menu because any user can access the Table Manager. However, the features in the Table Manager are restricted by user security permissions. |
|
| Define custom help for your browser-based files (Axiom forms and web reports). | |
|
View currently active data contexts for Axiom forms, and break save locks if needed. |
|
| View scheduled jobs, review job results, and run jobs on demand. | |
|
Assign users to roles and subsystems. |
Auditing
| Item | Description |
|---|---|
|
View the Axiom Budget Planning and Performance Reporting audit log to see what was done in the system, when it was done, and by whom. |
|
|
System logs |
View the application server log and the web client log. You can also change the current logging level for both. |
System status
| Item | Description |
|---|---|
|
Temporarily restrict access to the Axiom Budget Planning and Performance Reporting system. |
Infrastructure section
| Item | Description |
|---|---|
|
Rebuild table views |
Reset the table views for the installation. This should not be necessary on a regular basis, however, from time to time you may be instructed to do this manually when working with Axiom Support to troubleshoot an issue. |
|
Reset services |
View the servers associated with this Axiom Budget Planning and Performance Reporting installation, and reset them if needed. You can also clear the application server cache. This should not be necessary on a regular basis, however, from time to time you may be instructed to do this manually when working with Axiom Support to troubleshoot an issue. |
|
Network speed test |
Test the latency and bandwidth of your connection to the server. Axiom Budget Planning and Performance Reporting Support may ask you to perform this test as part of the technical requirements evaluation, or when troubleshooting an issue. |
Software configuration
| Item | Description |
|---|---|
|
Software updates |
Install product updates. |
|
Upload a new Axiom Budget Planning and Performance Reporting license for your installation. |
|
|
System configuration |
Modify certain system configuration settings relating to the launch page and login behavior. You can modify the following settings on this page:
Additionally, various Scheduler-related settings are exposed but these settings should only be changed by Axiom Support or at their direction. For more information about system configuration settings, see System configuration settings. |
Administration dashboard
The administration dashboard displays system status, licensing, and version information at-a-glance. The dashboard appears when you first enter the System Administration area. If you gp to a different page within the System Administration area, you can return to the dashboard by selecting Dashboard in the Navigation menu.
The panes across the top of the page show the following information:
| Pane | Description | Color coding |
|---|---|---|
|
System status |
Displays the current status of the system, either active for all users or limited to administrator access only. You can click the pane to go to the System Access page to change the current allowed access. |
|
|
Users logged in |
Displays the number of currently active user sessions. A single user may be counted multiple times if they are logged into multiple sessions simultaneously. You can click the pane to go to the Audit Manager to view information about user sessions. |
N/A: Pane is always blue. |
|
Standard users |
Displays the number of Standard user licenses for your installation, using the following format: UsedLicenses/TotalLicenses. This is intended to give you advance warning if you are close to using all of your available licenses. The license expiration date is shown at the bottom of the pane. If your licenses have different expiration dates, the closest expiration date is shown. You can click the pane to go to the Update License page to import an updated license. |
|
|
Viewer users |
Displays the number of Viewer user licenses for your installation, using the following format: UsedLicenses/TotalLicenses. This is intended to give you advance warning if you are close to using all of your available licenses. The license expiration date is shown at the bottom of the pane. If your licenses have different expiration dates, the closest expiration date is shown. You can click the pane to go to the Update License page to import an updated license. |
|
The information panes are only visible to system admins. Non-admin users with access to the System Administration area only see the system name and version details.
