Productivity visualization tabs
Use the Productivity visualization tabs to explore high-level variances between actual, budgeted, and benchmarked department data.
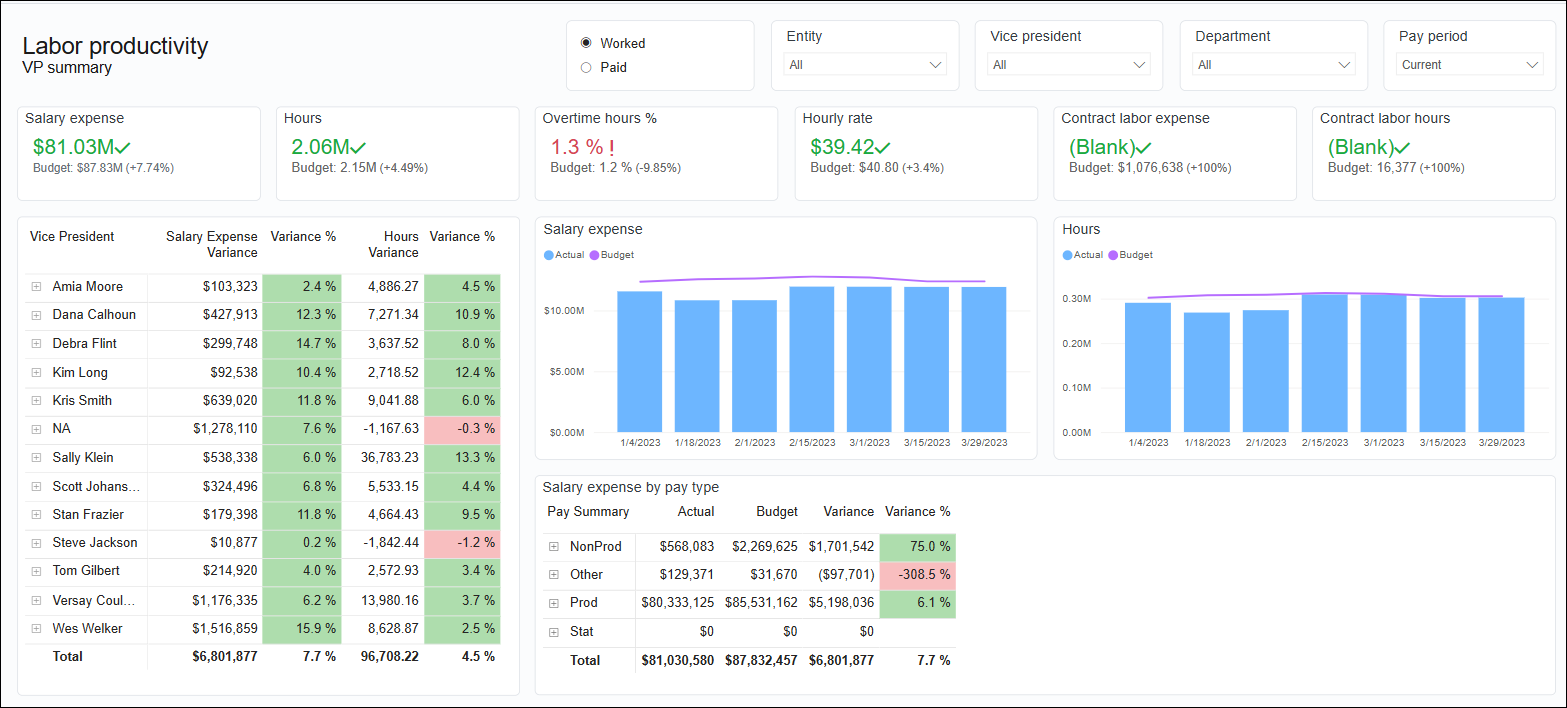
VP summary tab
This tab provides totals for each of the main reporting areas:
- Salary Expense
- Hours
- Overtime hours
- Hourly rate
- Contract labor expense
- Contract labor hours
The tab also includes variances, a comparison of actual to budget salary expense and hours, and salary expense by pay type.
Productivity features
The following features are available on the various tabs of the Productivity page.
| Feature | Description | Tab |
|---|---|---|
| Slicers |
Special filters for narrowing report data to the options selected from the following categories:
These slicers appear at the top of every tab in the report. Slicers are synchronized so that selections on one tab change data on the remaining tabs. You can make multiple selections from a slicer menu by pressing and holding Ctrl while making selections. |
All |
| KPI cards |
At-a-glance statistics for biweekly and year-to-date (YTD) variance amounts. The large numbers are actuals with the budgeted amount displayed in gray text under the actuals. YTD totals are based on the pay periods selected in the Pay Period slicer and always display the latest biweekly information. |
VP Summary Trend Analysis Department Detail |
| Bar graphs with trend items |
Interactive graphs that depict data over specified periods. Click a bar or a point on the trend line to view data related to just that item on the rest of the tab. |
VP Summary Trend Analysis Department Detail |
| Rollover toolbars |
A set of hidden tools for interacting with the report data. Each report section has a toolbar that appears just above the upper-right corner when you hover your cursor over the report section. Select a tool from the popup toolbar. |
VP Summary Department Summary Department Detail |
| Salary expense and hours variances by vice president table | Salary expense and hours variances and variance % broken out by VP. Expand to see the department and pay period. | VP Summary |
| Salary expense by pay period bar graph | Interactive graph that depicts salary expense based on drill level and selected areas of the graph. Hover your cursor over any point to view an informational popup or click a point to view related data on the rest of page. On the VP Summary tab, both bar graphs and the tables change to display data associated with the selected point. |
VP Summary Trend Analysis |
| Hours by pay period bar graph | Interactive graph that depicts hours based on drill level and selected areas of the graph. Click a bar on the graph to view data related to that item. On the VP Summary tab, both bar graphs and the tables also change to display data associated with the selected point. |
VP Summary Trend Analysis |
| Salary expense by pay type table | Click a listing in the table to view salary expense related to just that item in the rest of the tab sections. |
VP Summary |
| Hourly rate by pay period bar graph | Hover over a bar for hourly rate details. Click a bar to view data on the tab related to just that item. | Trend Analysis |
| Overtime hours % by pay period bar graph | Hover over a bar for overtime hours % details. Click a bar to view data on the tab related to just that item. | Trend Analysis |
| Contract labor expense by pay period line graph | Interactive line graph that displays contract labor expense. Click a point on the graph to view data on the tab related to just that item. | Trend Analysis |
| Productivity details by entity/pay Period/department table | Table with actual, budget, and variance for units of service, FTE hours, hours per unit, salary expense, and hourly rate, broken out by entity. Expand to see departments and pay periods. | Department Summary |
| Salary expense evaluation | Shows the opportunity, in dollars, for hours vs target and rate vs target. | Department Summary |
| Details by department bar graph | Select an item or unit to view your selection by pay period. | Department Summary |
| Productivity details by job class | Table with actual, budget, and variance, and variance percentage for hours, salary expense, hourly rate, and overtime hours, broken out by job class. Expand to see job code and pay detail. | Department Detail |
| Hours per unit by pay period bar graph | Actual and budgeted hours per unit broken out by pay period. Click a bar to view the number of hours. Hover over a bar to view the variance and variance percentage. | Department Detail |
| Actual/budget units of service, hours per unit, and variance % by pay period table | Actual and budgeted units of service, actual and budgeted hours per unit, and the variance percentage for each, broken out by pay period. | Department Detail |
| Salary expense variances by pay detail table | Variances and Variance percentages broken out by pay type. | Department Detail |
| Drill fields | Column of data items in each branch’s drill field. You can start a branch from any field with a plus symbol at the end. |
Additional tabs
The following tabs are also available on the Productivity page:
| Tab | Description |
|---|---|
| Trend Analysis | Compare actual to budgeted KPIs and column charts for Salary Expense, Hours, Average Hourly Rate, and Overtime %. |
|
Department Summary |
Switch logic incorporated to provide target results for a Benchmark, Flexible Budget, and Fixed Budget, respectively, depending on available department data. Calculations and pay period results are similar to what is found in the Department Management Productivity report. |
|
Department Detail |
Compare actual to budgeted KPIs and confirm the correlation between Worked and Paid hours provided at the job class, job code, and pay type level. |
