Productivity Dashboard: Executive Overview
The Executive Overview tab displays high-level, summarized productivity data intended for upper management. Two sub-tabs display information:
-
Summary
-
Detail
NOTE: When you open the dashboard, it defaults to the year-to-date information for the most current period. Use the Executive Overview refresh variables in the Filter pane to update the information on the dashboard.
Summary tab
The Summary tab contains the following features:
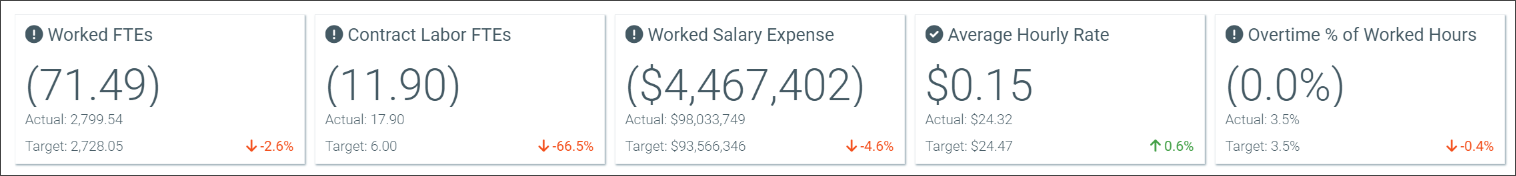
KPI metric cards
These cards at the top of the Summary tab display productivity information and comparisons of Actual to Target for the following:
-
Worked FTEs
-
Contract Labor FTEs
-
Worked Salary Expense
-
Average Hourly Rate
-
Overtime % of Worked Hours
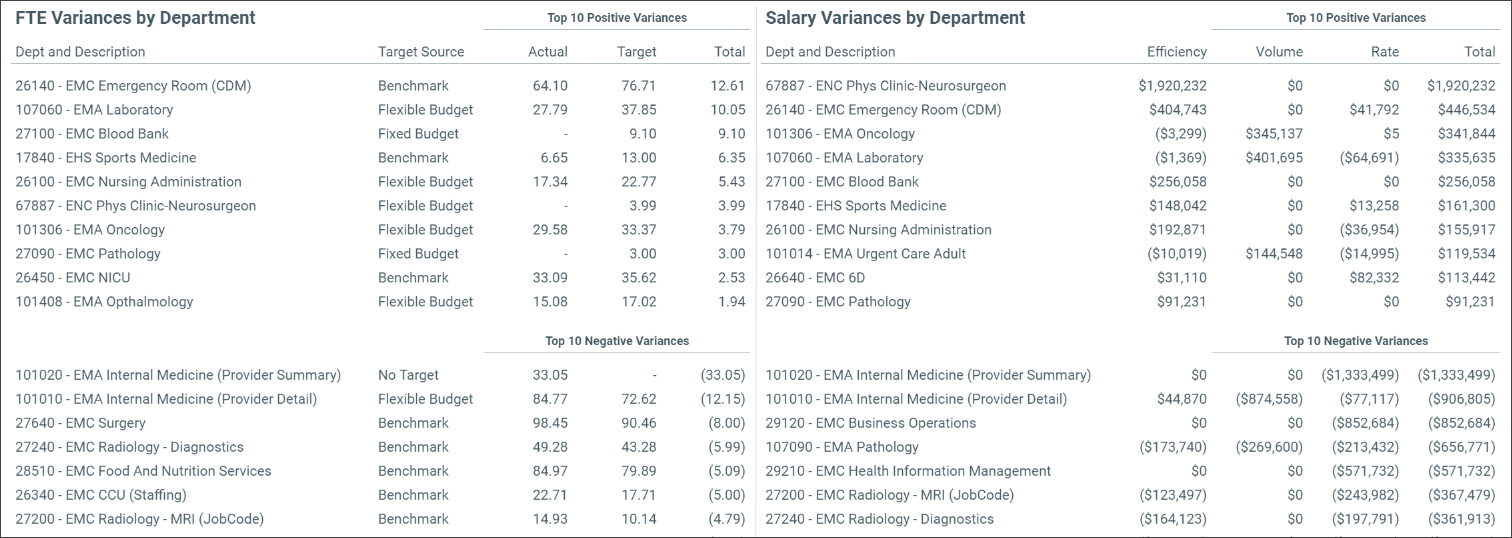
Top 10/Bottom 10 data
The upper part of this section displays the top ten positive/favorable variances and the lower part displays the bottom ten negative/unfavorable variances for the following:
-
FTE Variances by Department
-
Salary Variances by Department
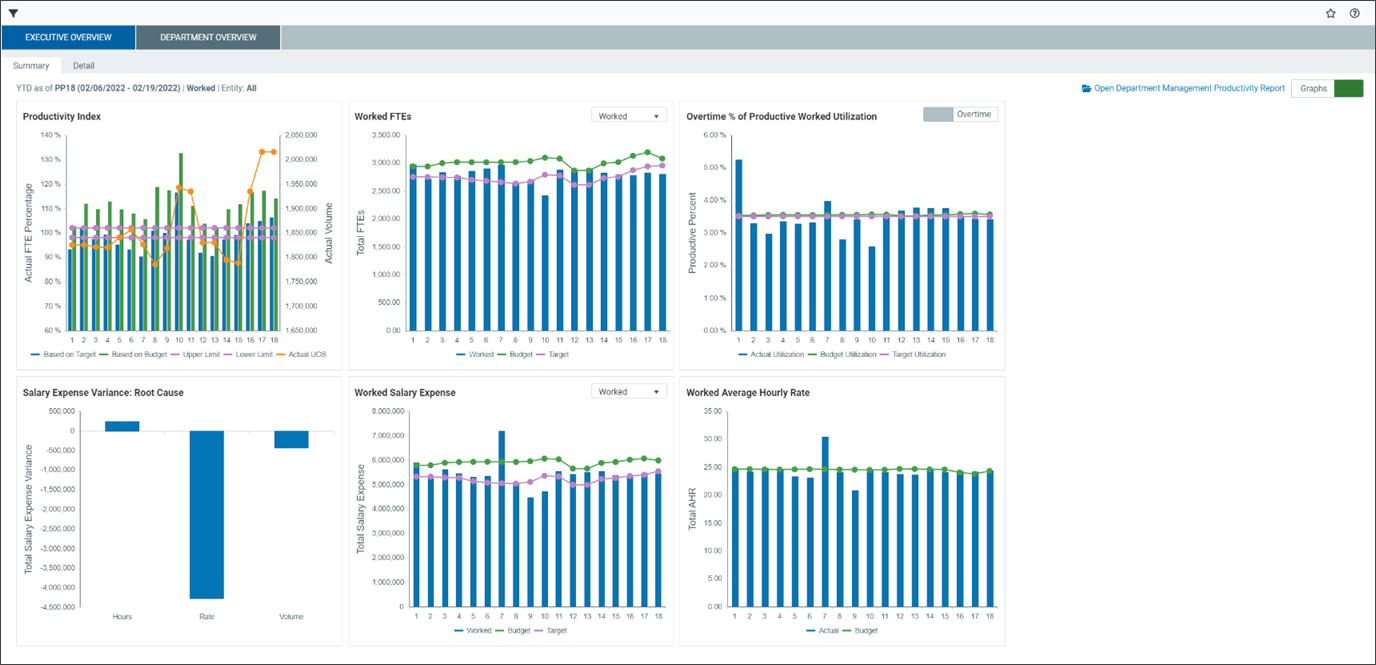
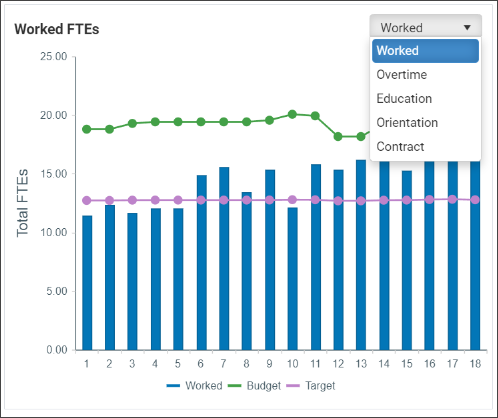
Trend view and graphs
Click the Matrix/Graph toggle button in the upper-right of the dashboard to display a graphical representation of the dashboard data. This view is dynamic and can be updated automatically with changes to the refresh variables. You can view graphs for the following:
-
Productivity Index
-
Worked FTEs
-
Overtime Utilization
-
Salary Expense Variance: Root Cause
-
Worked Salary Expense
-
Worked Average Hourly Rate
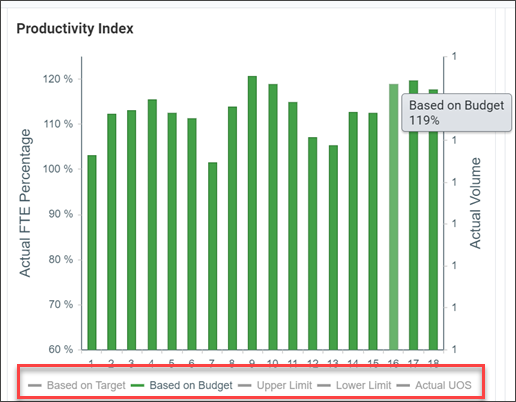
The graphs are interactive. Hover over a section of one of the graphs to display a tooltip that contains information specific to that column. You can also reduce the amount of data shown on the graph by enabling or disabling the options under the graph. For example, on the Productivity Index graph, to display only the Based on Budget data, click the other options to remove them from the graph. Click the options again to return them to the graph.
On the Worked FTEs and Worked Salary Expense graphs, click the dropdown in the upper-right of the graph to view the following types in information:
-
Worked
-
Overtime
-
Education
-
Orientation
-
Contract
-
Premium (Worked Salary Expense)
Details tab
This tab displays department details as well as summarized information related to those departments. Similar to the Summary tab, the information on this tab is dynamic and you can update it as needed through refresh variables or targets.
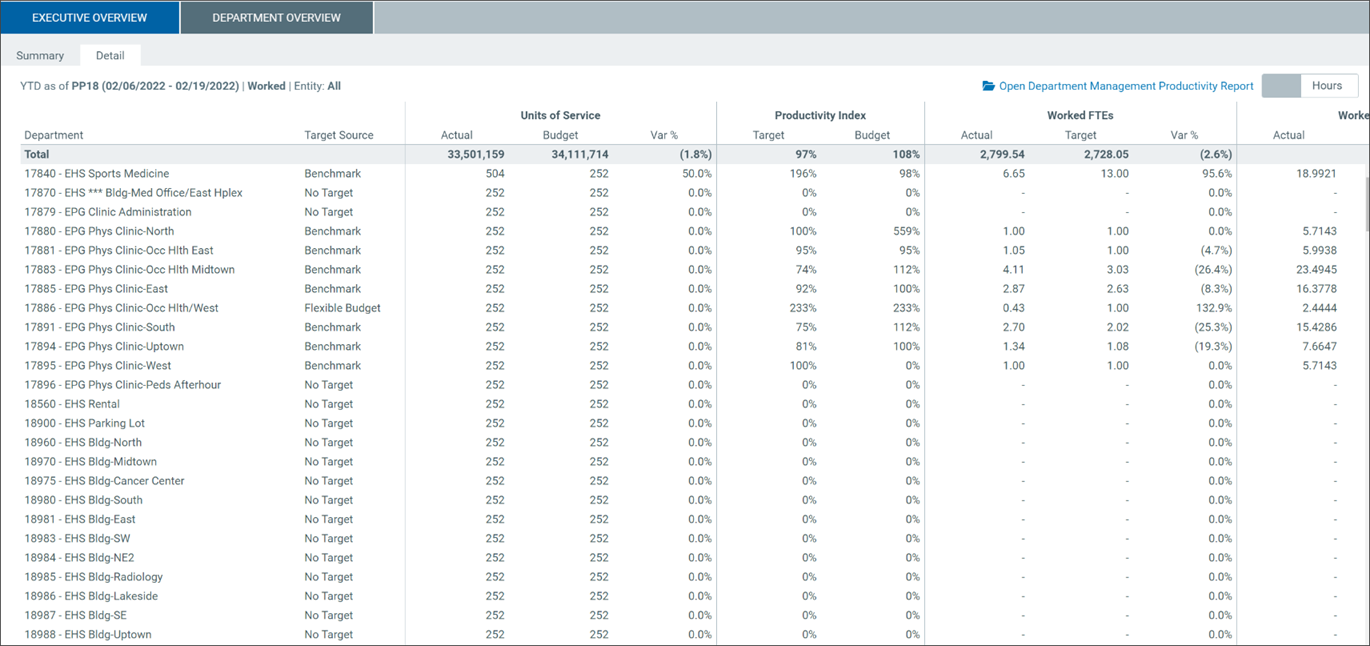
Hours/Dollars toggle
Click the Hours/Dollars toggle in the upper-right of the dashboard to alternate between hourly and dollars data.
