View and filter the Month End Review dashboard
-
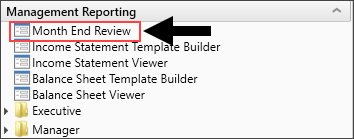
In the Mgmt Reporting or Mgmt Admin task pane, in the Performance Reporting section, double-click Month End Review.
-
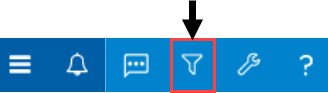
To filter the data for the dashboard, in the upper left tool bar, click the funnel icon.
-
Complete the following filter options, as needed:
Option Description Time Period Select the period and year. Target (All Except Statistical) Select one of the following target types:
- Budget (Default setting when the dashboard is opened)
- Flex
- 3 Month Avg
- 6 Month Avg
- 9 Month Avg
- 12 Month Avg
For the 3, 6, 9, and 12 month average targets, Period is the only available setting; YTD is disabled when one of these options is selected.
- Last Month
- Same Month LY
NOTE: This filter does not apply to the Executive Overview > Statistical Overview tab.
Category & Filter (Summary & Executive) - From the Select Category dropdown, select the organization level in which to view data. For example, to view all of the departments and accounts at the VP level, select VP.
- From the Select Filter dropdown, select the filter created by your organization.
NOTE: This filter applies only to the Summary and Executive Overview tabs.
Target (Only Statistical) Select one of the following target types, which are fixed in the Executive Overview > Statistical Overview tab.
- Budget
- 4 Month Average
- Last Month
- Same Month LY
Dept (Only Operational) Select the department to filter the data in the Operational Overview tab.
NOTE: The dropdown includes more departments than what the system shows. To include a specific department, we recommend entering the department number into the field. Also, note that the list only includes those departments assigned to you.
- Click Apply.
